Sportsbook Spillovers: Kalshi's Forecasting Markets Tilted Toward Longshots After the Sports Launch
After Kalshi launched sports markets in January 2025, taker order flow in its non-sports markets tilted toward longshots and longshot returns deteriorated. We document the shift with 593 million trades, multiple-testing corrections, and complete robustness reporting.
Abstract
Prediction markets are increasingly used to forecast elections, economic data, and policy outcomes. Their prices aggregate information well when the typical trader holds a genuine view about the underlying event, and poorly when the typical trader is buying a small chance of a large payoff. However, on January 23, 2025, Kalshi, a federally regulated event exchange, launched sports markets, and within two months sports accounted for more than half of its volume. In short, the platform's forecasting markets began to share a user base with a sportsbook. We measure what happened to taker order flow and returns in Kalshi's non-sports markets using approximately 593 million trades from 2021 through August 2026. In particular, we find that the share of taker flow buying longshot contracts (priced 1 to 20 cents) rose from 52.1 to 65.7 percent, across political, financial, and residual categories alike, and that in markets resolving within 60 days the weekly average longshot return fell from +8.3 to −21.6 percent. The platform already exhibited a favorite-longshot bias before the launch, and the shift operates through newly created markets rather than within existing ones. Realized trader losses exceeded pre-launch loss rates by roughly $13 million, an estimate we report as accounting because it is not statistically distinguishable from zero under market-clustered inference. Eight of twelve headline tests survive a Holm multiple-testing correction, and we report every failed specification.
1 Introduction
Regulated prediction markets are being increasingly used in high-visibility settings, such as election forecasting and the pricing of macroeconomic announcements. While these markets can provide great benefit as forecasting tools, their value depends on the composition of their participants. Prices aggregate information effectively when the typical trader holds a genuine view about the underlying event (Wolfers and Zitzewitz 2004), and they do so less effectively when the typical trader is purchasing a small chance of a large payoff, in the manner of a lottery participant. The betting literature summarizes this lottery-like pattern with the favorite-longshot bias, the tendency of bettors to pay too much for unlikely outcomes and too little for likely ones. Accordingly, the strength of this bias in a market is a compact indicator of who is trading in it.
Until recently, Kalshi's users had self-selected into forecasting markets on elections and economic data. However, the official launch of sports markets on January 23, 2025 introduced a product with mass-market appeal, and within two months sports contracts accounted for more than half of platform volume. The platform imposes no separation between products. For example, an account opened to bet on a football game can trade contracts on inflation or elections at no additional cost, so habits formed in one product can carry into the other. In short, the launch gave the forecasting markets access to an entirely new population of traders.
If sports-betting behavior spilled into the forecasting markets, it should be observable in three measurable quantities: the side of the market that aggressive order flow takes, the distribution of that flow across the price range, and its subsequent realized returns. We measure all three and make three contributions. First, we document a large, category-wide shift of taker flow toward longshot contracts after the launch. Second, we show that the returns to that flow deteriorated to levels typical of conventional betting markets. The platform already had a favorite-longshot bias (Buergi, Deng and Whelan 2026), but before the launch its losses were concentrated in a few high-volume episodes such as the 2024 election, and in a typical week longshot buyers came close to breaking even. Third, we demonstrate that the shift operates through the extensive margin, meaning newly created markets and the flow arriving in them, rather than within pre-existing markets. This pattern is consistent with a mechanism of new participants and new market types rather than repricing of existing instruments.
Our design is an observational, platform-level event study rather than a controlled experiment. Section 2 reviews related work, Section 3 describes the data and methods, and Section 4 presents the results. Section 5 sets out threats to identification, including pre-trends and gaps in data coverage, and the checks that bound them. Section 6 separately describes the platform's post-May-2026 transformation, which the statistical analysis deliberately excludes, and Section 7 concludes.
2 Related work
The favorite-longshot bias is among the most robust regularities in the betting literature, documented from early parimutuel studies (Griffith 1949) through modern syntheses (Thaler and Ziemba 1988). Snowberg and Wolfers (2010) examine whether it reflects a taste for risk or a misperception of small probabilities. Wolfers and Zitzewitz (2004) set out the case for prediction markets as information aggregators, a case that rests on the participants being informed. Closest to this work, Buergi, Deng and Whelan (2026) provide the first systematic evidence on Kalshi's pricing, documenting a clear favorite-longshot bias and higher returns for makers than for takers. We extend their sample period and treat the sports launch as an event, asking how the bias changed when the platform's user base did.
3 Data and methods
3.1 Preliminaries
We study non-sports markets on Kalshi around the launch date of January 23, 2025. On every trade, the maker is the party whose order was resting on the book, and the taker is the counterparty who crossed the spread to trade against it. Takers skew toward retail participants, while makers skew toward professional liquidity providers. A longshot denotes a contract priced at 1 to 20 cents, an implied probability below 20 percent.
Consider every non-sports trade in which the YES contract is priced as a longshot. We call the fraction of such contracts in which the taker bought the YES side, rather than selling against it, the longshot YES-taker share. The excess return on a resolved position is its payout minus its entry price, divided by the entry price, and we dollar-weight it following Buergi, Deng and Whelan (2026).
More formally, let w index weeks, and let yw denote a weekly outcome, such as the longshot YES-taker share or the dollar-weighted taker excess return on longshot entries. Let Postw indicate weeks on or after the launch. We estimate
yw = α + β · Postw + εw
and test whether β differs from zero.
3.2 Data collection
The analysis is based on what is, to our knowledge, the largest public dataset of prediction-market activity, assembled with Jon Becker's open-source collection framework. Following the refresh conducted for this article, the dataset comprises approximately 593 million Kalshi trades and 38 million market records spanning June 2021 through August 4, 2026. Each trade record identifies the taker side, the prices of both contracts, and the quantity, and each market record supplies the resolution outcome and its timing.
Collection faces a persistent constraint. Kalshi's public data interface returns trades from approximately the most recent 72 days only, and older history is no longer served. We verified this directly: a market with millions of recorded trades returns data for May 26, 2026 and returns nothing for May 5, 2026. Accordingly, any interval not collected within that window is lost, and the assembled history has such holes. It is complete from June 2021 through November 25, 2025. No trades survive for November 26, 2025 through February 21, 2026. Coverage from February 22 through May 1, 2026 is partial, limited to markets already known to the collector, which are mostly long-lived ones. May 2 through May 24, 2026 is missing, and the history is complete again from May 25, 2026 onward. The platform's history therefore cannot be reconstructed retrospectively and must be recorded continuously.
3.3 Sample construction
By mid-2026 the platform listed tens of millions of multi-leg combination markets and nearly two million cryptocurrency markets lasting an hour or less, and by July it cleared roughly eight million trades per day, several hundred times its 2024 rate of about 15,000. Data from this later era differs from the historical sample in both platform character and collection method. Therefore, no statistical comparison in this article crosses the May 2026 boundary. All tests use the sample ending May 1, 2026, combined with market resolutions recorded through August 2026. The resolution update is material, as thousands of markets open in the spring have since settled. Because late 2025 and early 2026 are missing or only partly collected, we also re-estimate every headline test with the post-launch period ending November 25, 2025, the last day of complete coverage (Section 5.2). The post-gap era is described separately in Section 6.
All results are restricted to markets with at least 100 contracts of lifetime volume, the rule applied throughout the historical collection, so that the measured universe remains stable over time. We classify markets as sports or non-sports using a curated list of ticker prefixes matched longest-first. Keyword-based classification was evaluated and rejected during auditing. For example, it assigns UKRAINE-prefixed markets to a weather category because the name contains the string RAIN.
3.4 Event date and the 2024 election
The event date is January 23, 2025, the official sports launch. A small number of sports markets existed from October 2024, but their volume was negligible. Following the official launch, growth was rapid: sports exceeded 25 percent of platform contract volume in the week of March 17, 2025, exceeded 50 percent the following week, and reached a maximum weekly share of 92 percent in late 2025.
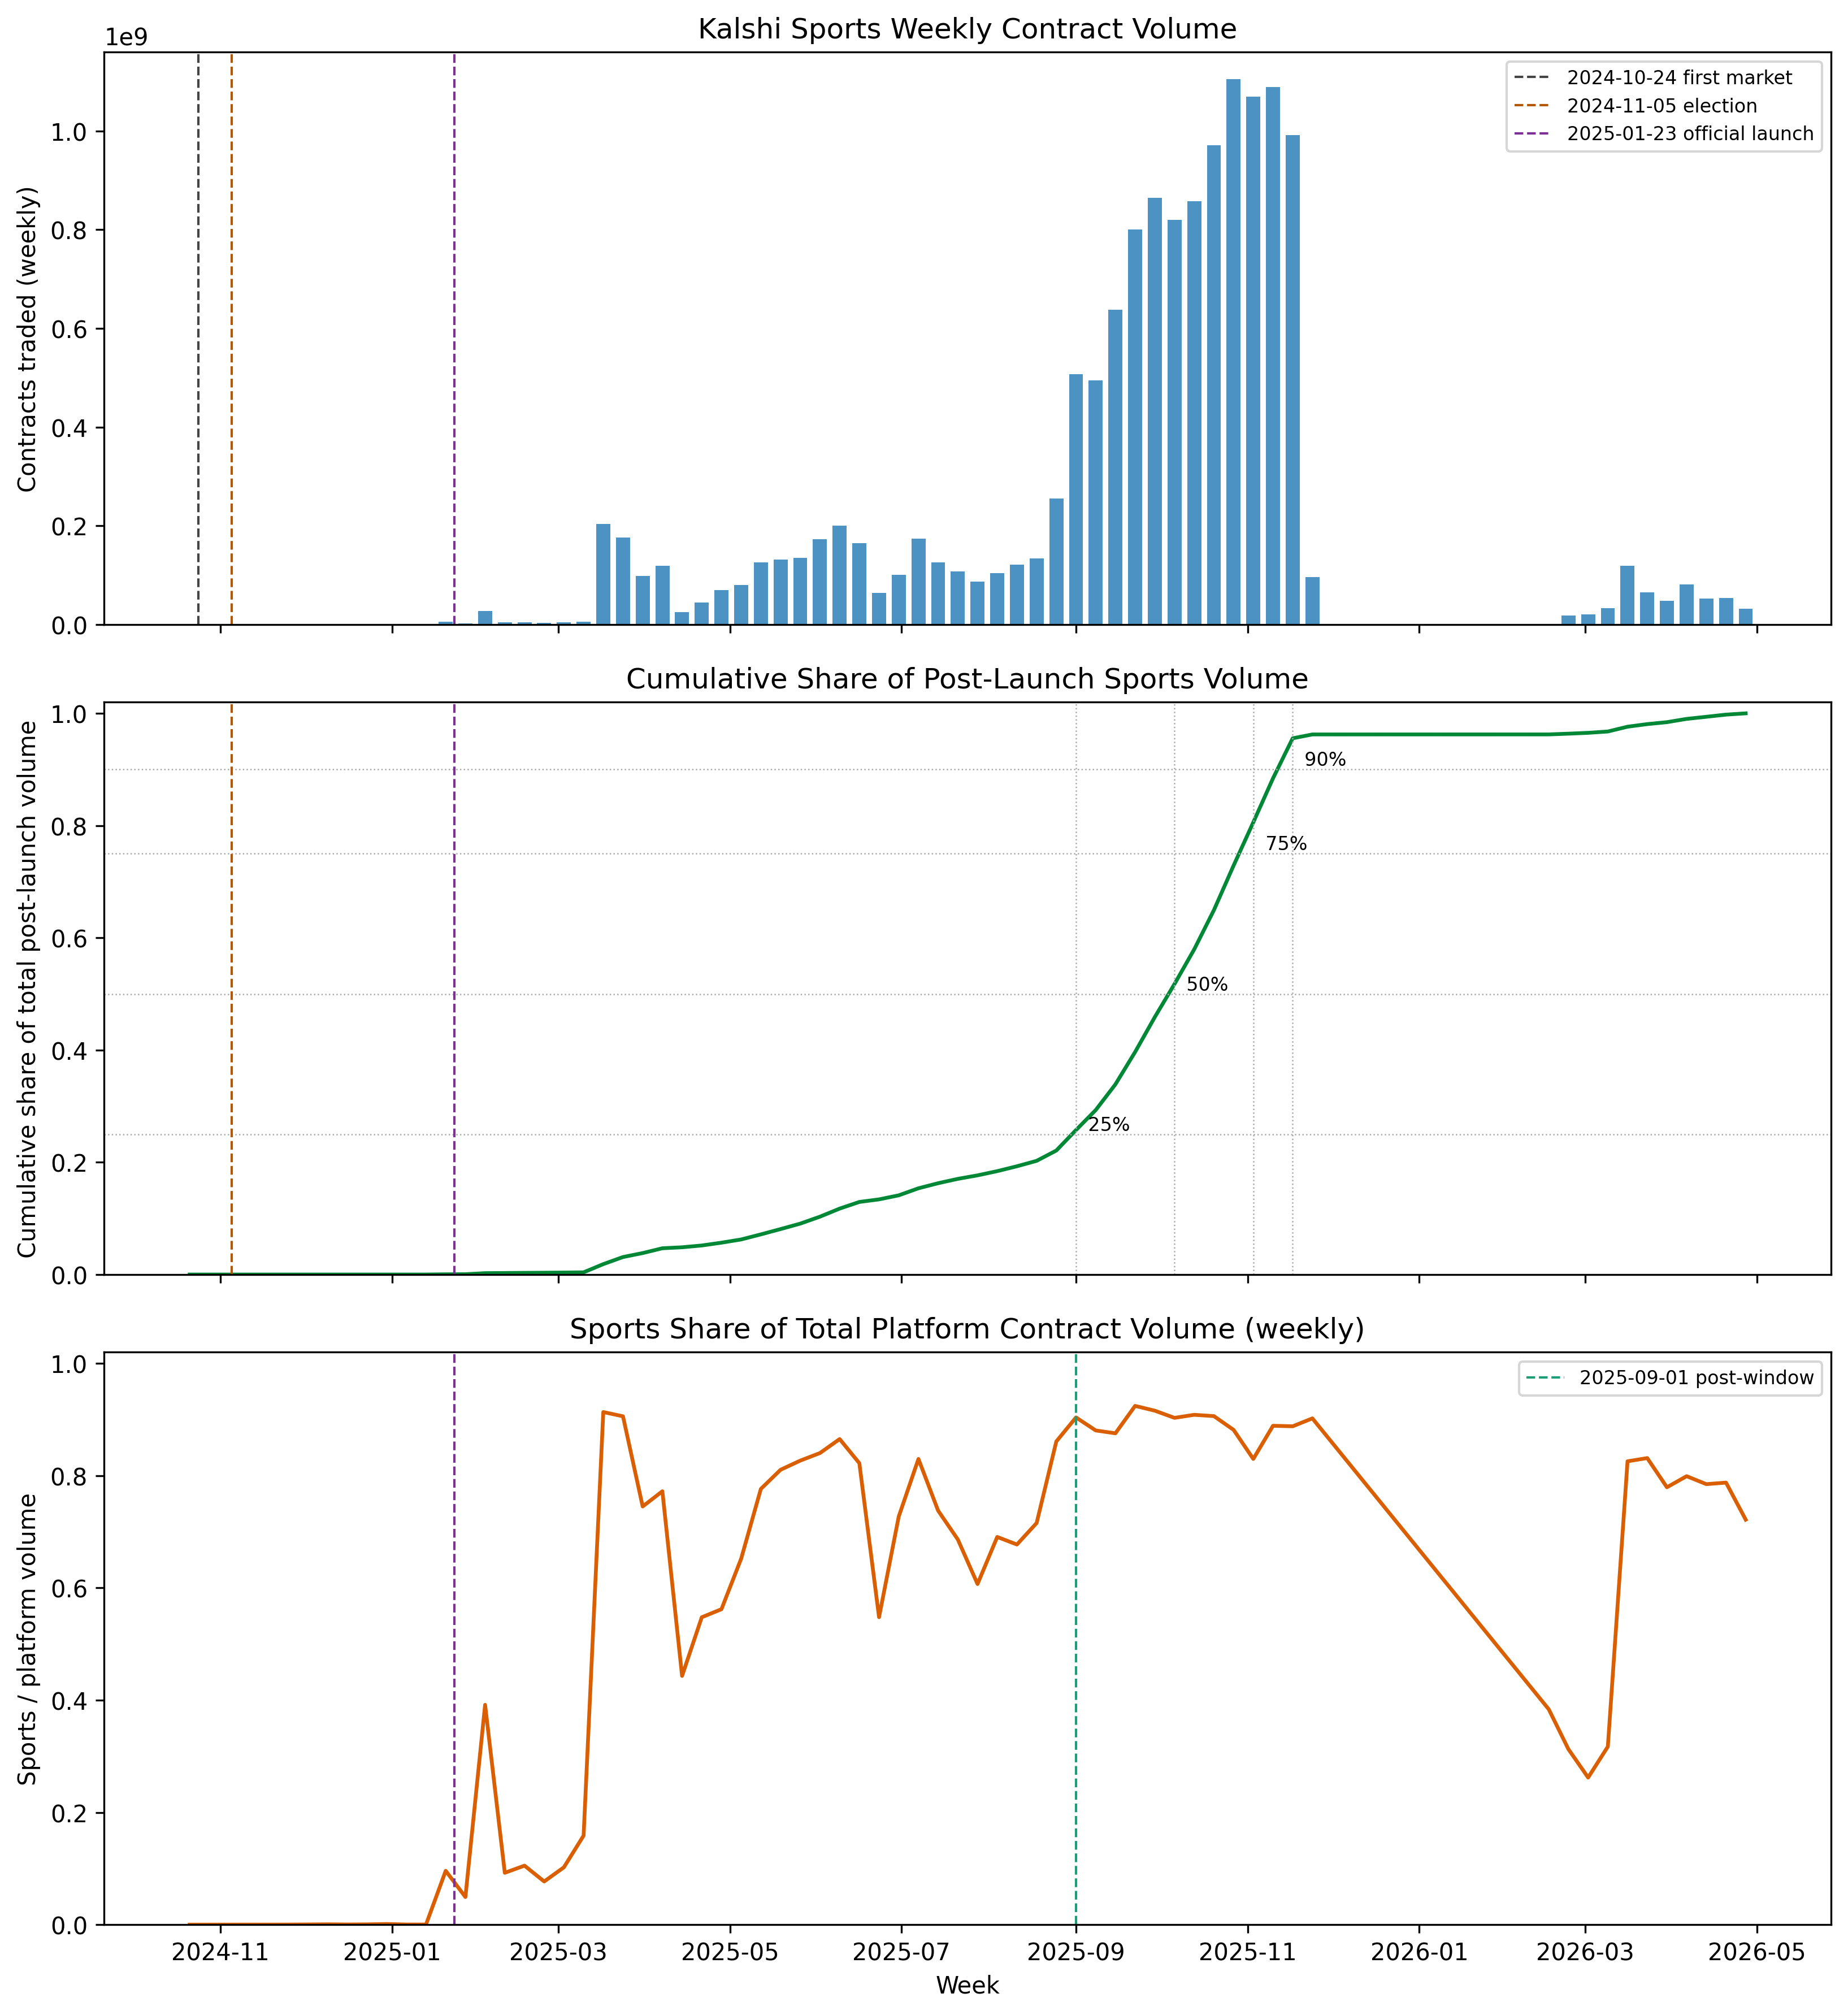
The pre-launch period includes the 2024 United States election, the highest-volume and most retail-intensive episode in the platform's history before the launch. For the returns results this inclusion is conservative, because election-period losses raise the pre-launch average loss rate and thus reduce the measured post-launch deterioration. As a robustness check, we re-estimate all results with the pre-launch period restricted to the twelve months preceding the event date. The composition shift is larger under that restriction (+16.8 percentage points rather than +13.6), and the returns deterioration remains substantial (−28.8 percentage points, p = 0.003).
3.5 Inference
We test weekly outcome series with Newey-West standard errors (lag 4), using moving-block bootstrap p-values as a small-sample complement. The within-market specification adds market fixed effects and a market-age control, with standard errors clustered by market and absorbed effects counted in the degrees-of-freedom correction.
Aggregate dollar figures require separate treatment. All dollars staked in a single market settle together, so treating each dollar as an independent observation overstates precision. Accordingly, we evaluate dollar figures with a market-level bootstrap of 1,000 draws. Twelve headline tests constitute the inferential family, and every reported significance level carries a Holm-Bonferroni correction for the number of tests. The complete output of sixty tests, including failures, is available in the replication repository.
4 Results
4.1 Composition of taker order flow
We find that the longshot YES-taker share rose from 52.1 percent before the launch to 65.7 percent after it, an increase of 13.6 percentage points (Holm-adjusted p ≈ 10⁻⁶).
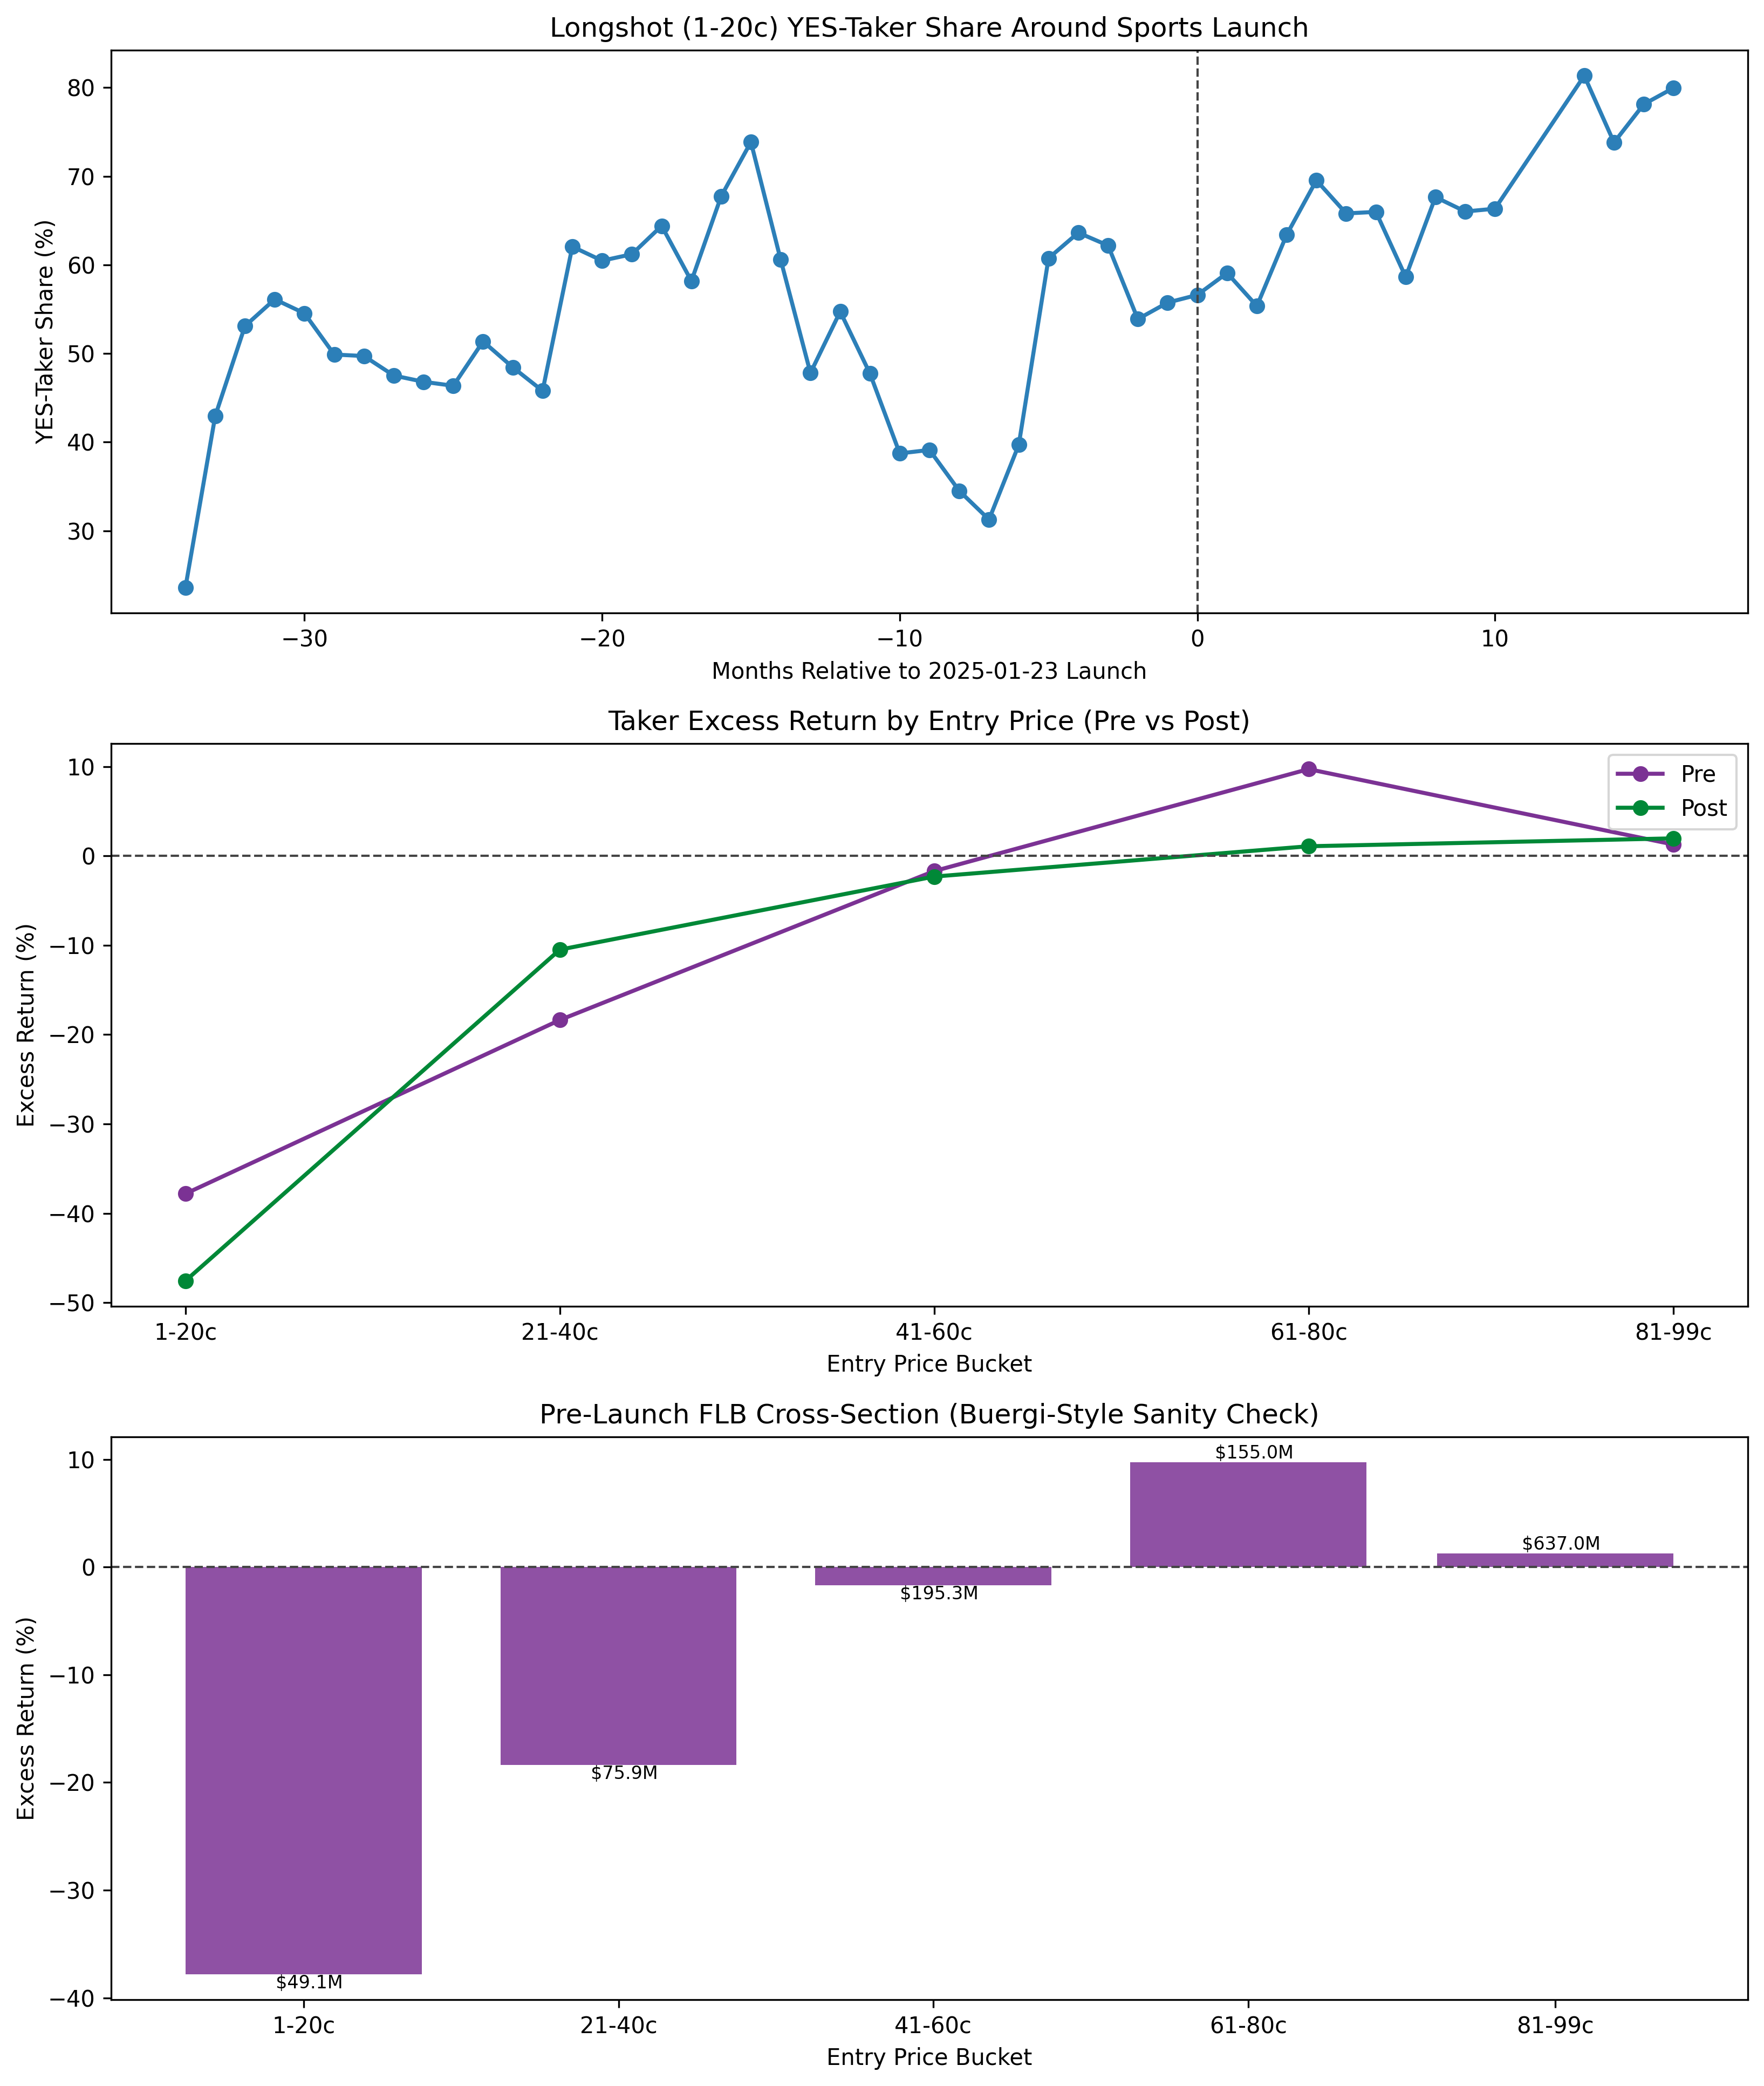
Three further results establish the breadth of the change. First, the shift appears in every market category: +8.2 percentage points in political markets, +9.9 in financial and economic markets, and +5.9 in the residual category, each significant after adjustment. Second, the shift is not confined to the cheapest contracts. Across the full 1-to-99-cent price range, taker buying tilted toward cheaper contracts after the launch, and the change in this price gradient is itself highly significant. Third, the shift operates through new markets rather than existing ones. When each market is compared only with itself, restricting attention to markets that traded on both sides of the event date and controlling for market age, the estimated within-market change is −1.2 percentage points and statistically indistinguishable from zero (p = 0.53).
This within-market null is not evidence that trading behavior was unchanged. Instead, it locates the change: the platform-wide shift derives from newly created markets and the flow arriving in them. Similarly, a duration-restricted specification gives the same answer on a stable population. Restricting both periods to markets resolved within 60 days of creation, the composition shift is +8.0 percentage points (Holm-adjusted p ≈ 10⁻⁴).
4.2 Taker returns on longshot positions
Kalshi had a favorite-longshot bias before the launch, as Buergi, Deng and Whelan (2026) document. Pooled over every dollar, longshot takers in non-sports markets lost 37.8 cents per dollar. However, those losses were concentrated in a small number of high-volume weeks. In a typical week longshot takers came close to breaking even, and in the 60-day-resolution subsample the weekly average was positive, at +8.3 cents per dollar. After the launch, returns deteriorated on every measure examined.
| Specification | Before | After | Statistical assessment |
|---|---|---|---|
| Weekly average taker excess return, entries at 1-20 cents | −2.5% | −42.2% | significant after adjustment (p ≈ 6×10⁻⁵) |
| Pooled dollar-weighted excess return | −37.8% | −47.6% | reported as description |
| Markets resolving within 60 days only | +8.3% | −21.6% | significant after adjustment (p ≈ 10⁻⁶) |
| Post-launch period beginning September 2025 | −2.5% | −46.9% | significant (p = 0.003, bootstrap p = 0.028) |
The rows serve distinct purposes. The first is the formal time-series test, which treats each week as one observation. The second weights every dollar equally and is the appropriate measure of aggregate trader experience. It differs from the first because a small number of high-volume election weeks dominate dollar totals. The third is the cleanest like-for-like comparison, and it shows the sign of the returns reversing. The fourth shows that the result does not depend on the immediate post-election months, since it holds when the post-launch period begins in September 2025, by which point sports constituted roughly 74 percent of platform volume.
A natural alternative explanation is that longshot contracts became worse purchases after the launch for reasons unrelated to who was buying them. That explanation implies a mirror-image improvement on the maker side of the same trades. Instead, we find that the maker-taker return gap widened sharply after the launch (joint test p ≈ 3×10⁻⁴). In short, the composition of demand changed, not the underlying events.
4.3 Aggregate losses
Applying pre-launch loss rates, computed within each price range, to post-launch trading volumes yields expected taker losses of approximately $12.7 million in non-sports markets after January 2025. Realized losses were approximately $25.7 million. The difference, roughly $13.0 million, measures the additional cost associated with the post-launch shift in behavior. These totals cover only the trading in the sample, so the missing and partial months of late 2025 and early 2026 are not included in them.
The composition of the excess is informative. Approximately $5.4 million arises in the 1-20 cent range. The largest single component, $16.2 million, arises in the 61-80 cent range, where takers earned positive returns before the launch and approximately zero after. The pre-launch user base's advantage on likely outcomes disappeared together with its discipline on unlikely ones.
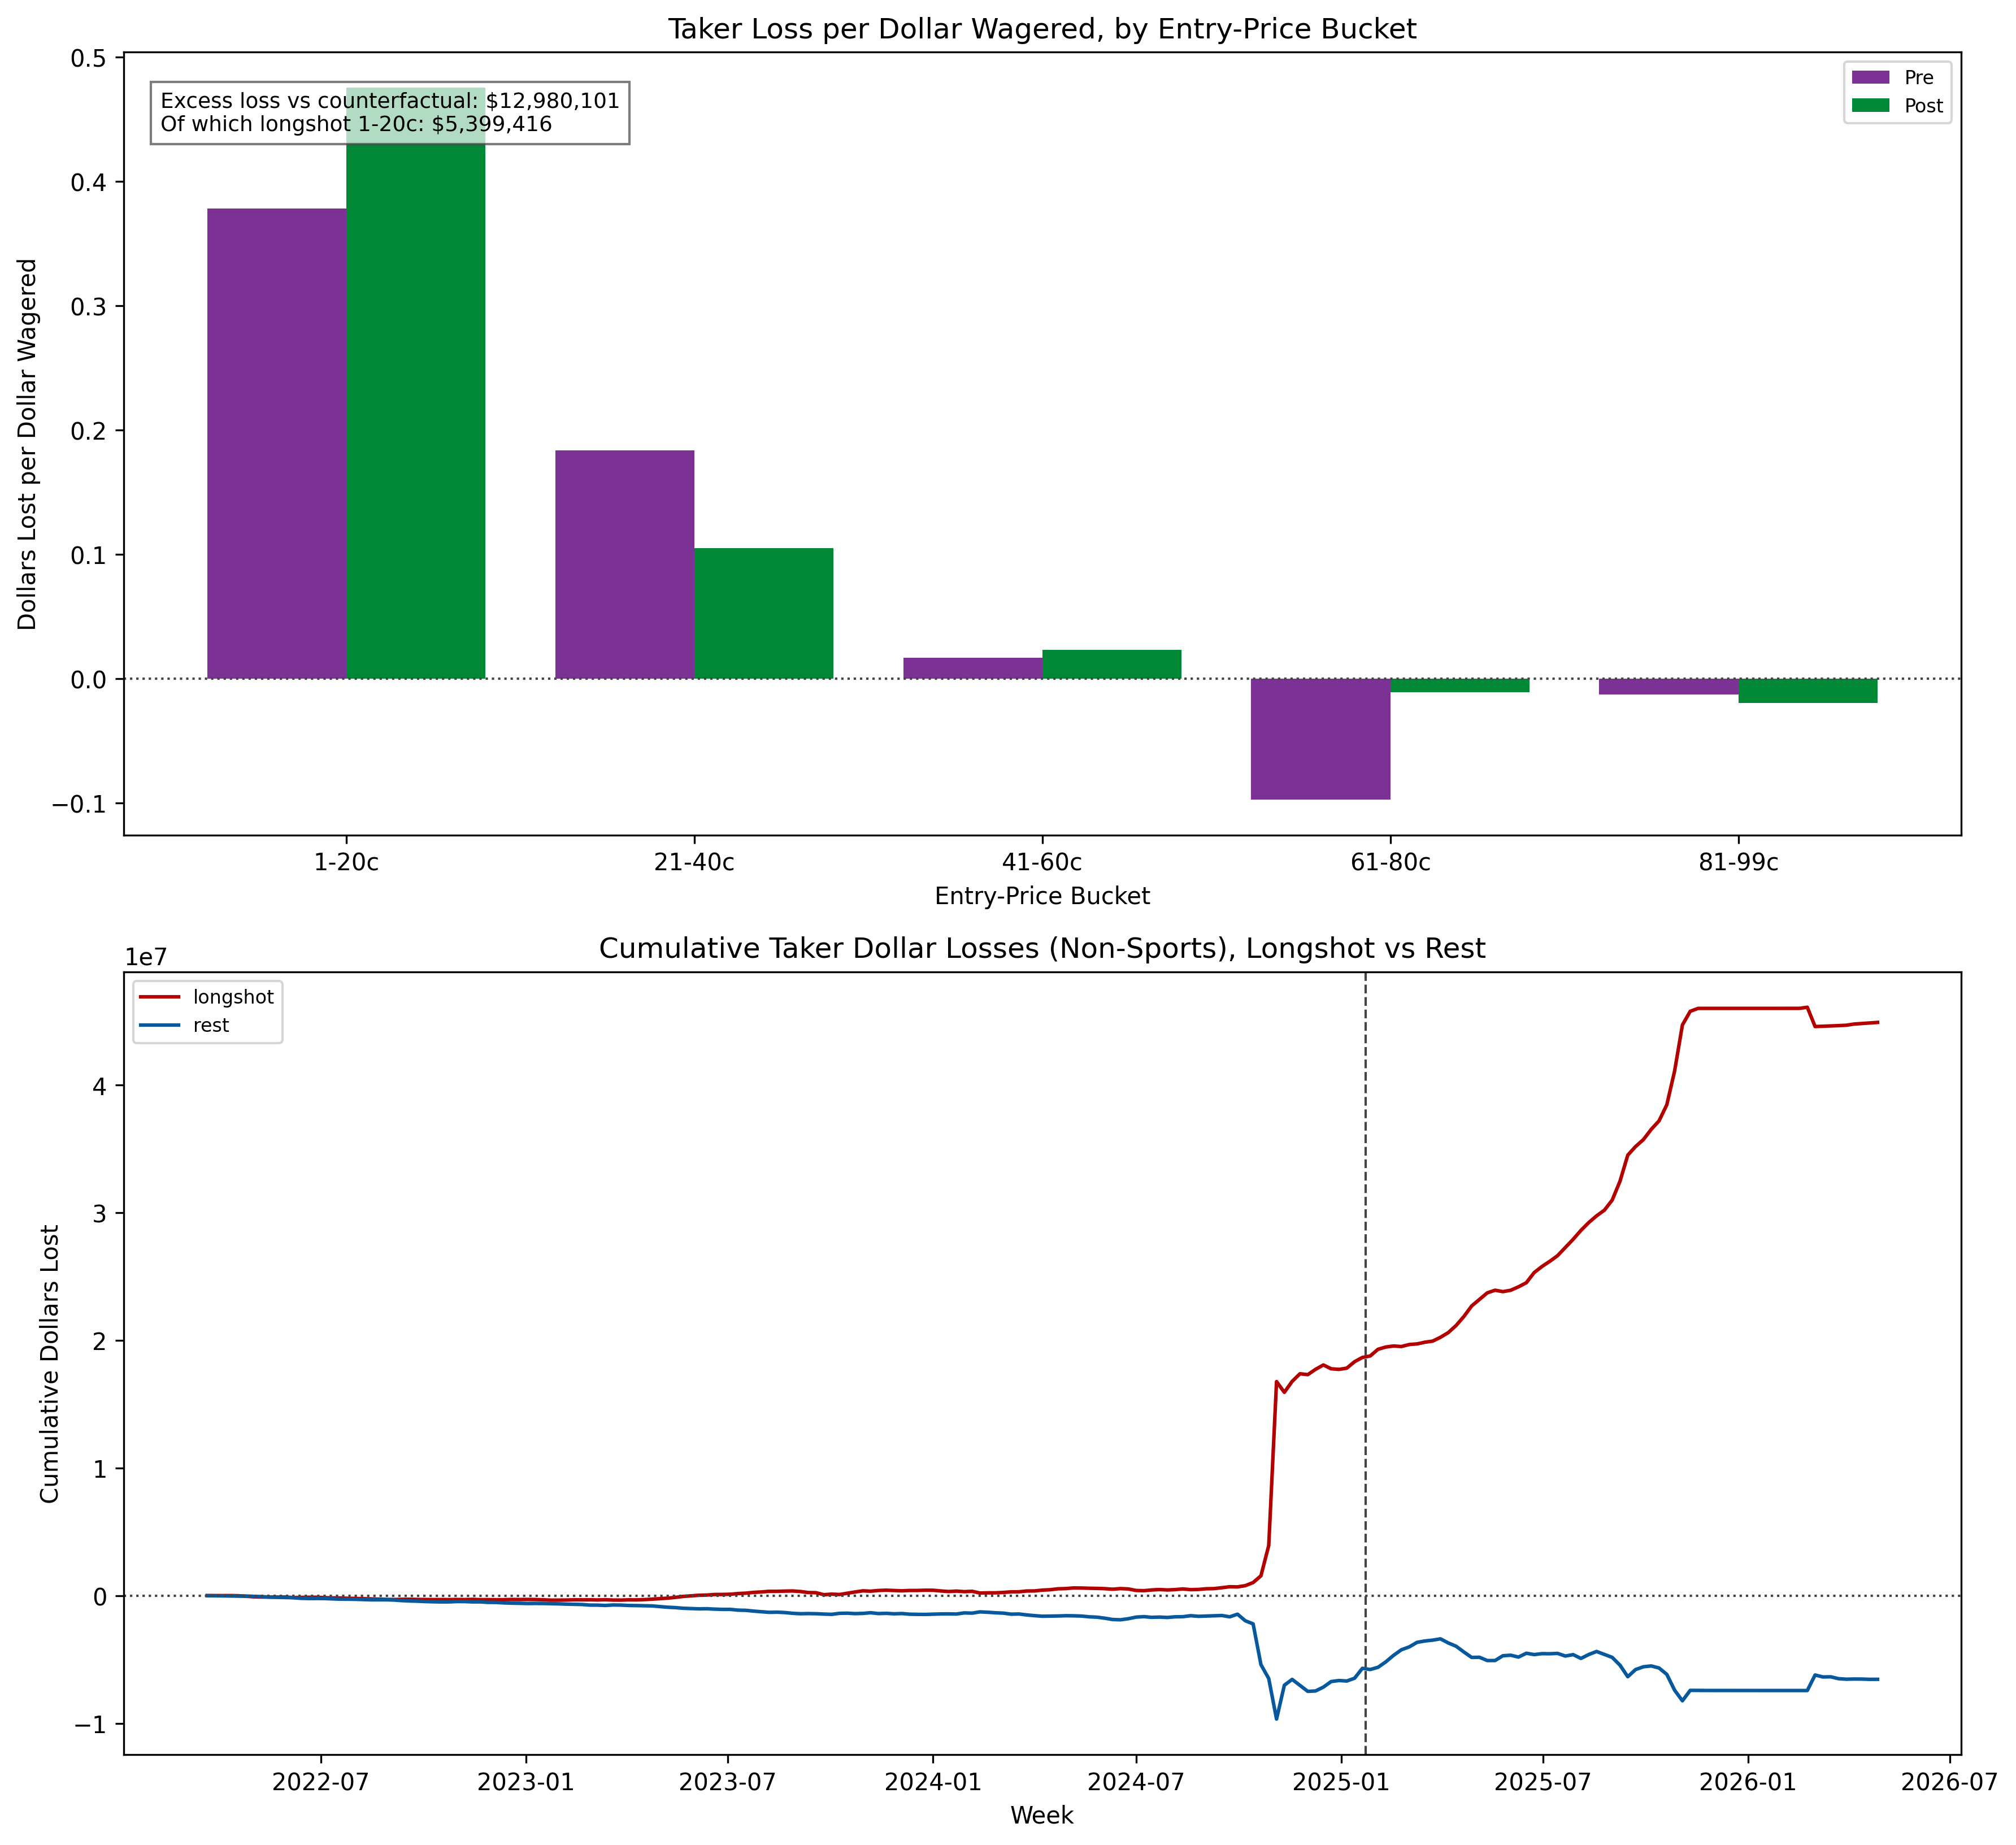
These dollar figures deserve limited statistical confidence. An earlier version of this analysis attached strong significance to the excess using a procedure that implicitly treated each dollar as an independent observation. That procedure is invalid, because dollars within a market settle jointly and the correct unit of evidence is therefore the market. Evaluated with a market-clustered bootstrap, the excess is not statistically distinguishable from zero (p ≈ 0.27), because aggregate outcomes are dominated by a small number of very large markets. Thus the findings of Sections 4.1 and 4.2 constitute the statistically supported results, and the dollar figure represents the magnitude they plausibly imply. We present it as accounting rather than as evidence.
5 Threats to identification
5.1 Pre-trends
The longshot share of taker flow was already rising during 2024, before the event date, and the twelve-month pre-launch trend is statistically significant for both primary outcomes. Much of this drift coincides with the election cycle. We bound the concern with three checks. First, a placebo exercise imposing an artificial event date inside the stable 2023 period detects no effect (p = 0.66). Second, the results are unchanged when the post-launch period begins in September 2025, well after the election cycle. Third, the composition shift survives exclusion of the largest post-launch markets, so no single prominent market accounts for it. Attributing part of the measured magnitude to lingering election-era participants, rather than to arriving sports bettors, remains a defensible partial interpretation. The twelve-month-pre and September-2025 estimates bound its possible size.
5.2 Coverage gaps
The post-launch sample has no trades from November 26, 2025 through February 21, 2026, and only partial coverage, mostly of long-lived markets, from February 22 through May 1, 2026 (Section 3.2). A selected partial window could in principle drive the headline estimates. Accordingly, we re-estimate with the post-launch period ending November 25, 2025, the last day of complete coverage. The conclusions are unchanged. The longshot YES-taker share rises from 52.1 to 63.3 percent (+11.1 percentage points, p ≈ 5×10⁻⁷). The weekly longshot taker excess return falls from −2.5 to −43.6 percent (p ≈ 3×10⁻⁸). Category shifts are +6.2 (political), +5.9 (financial) and +3.8 (residual) percentage points, each with p < 0.002. The 60-day-resolution results are identical, because no 2026 trade enters that specification. Thus the partial 2026 months account for about 2.5 of the 13.6-point headline composition shift, and none of the returns result.
5.3 Absence of a cross-platform control
The natural alternative design would compare Kalshi's markets against Polymarket's as a control group. We constructed that design and then set it aside on the basis of its own diagnostics. The two platforms' volumes were already diverging significantly before the event date, so the parallel-trends assumption underlying the comparison fails. We report no estimate from a design whose central assumption fails.
5.4 Unresolved markets at the sample boundary
Return calculations require known outcomes, and markets unresolved at the end of the sample are excluded, which could in principle distort estimates near the boundary. The 60-day-resolution specification addresses this concern directly, and the principal returns result survives it.
5.5 Fees
We do not model trading fees. Their inclusion would reduce every reported return, so the documented deterioration is understated in this respect.
6 The platform after May 2026
The post-gap data, covering May 25 through August 4, 2026, describes a platform transformed a second time. Kalshi cleared roughly 6.5 million trades per day in June 2026 and 8.5 million in July. Since May 25 it has listed more than 26 million multi-leg combination markets, most of them sports parlays, and nearly two million cryptocurrency markets lasting an hour or less. Fifteen-minute Bitcoin contracts alone traded about 7 billion contracts.
Our market classification predates many of these new series. For example, the 2026 World Cup, tennis, and cricket markets are not on its sports list, and sports parlays whose tickers begin with KXMVESPORTS are mislabeled as esports. Non-sports statistics for this era are therefore contaminated by sports flow, and we do not report them. The same issue accounts for under 0.5 percent of non-sports volume in the estimation sample. Because both the platform and the collection method differ across the boundary, we present this era as description only.
7 Conclusion
For its first four years, Kalshi's forecasting markets showed the favorite-longshot bias found throughout the betting literature, but in a typical week it was mild, with most losses on unlikely outcomes concentrated in a few high-volume episodes such as the 2024 election. In the months following the January 2025 sports launch, taker order flow in those same market categories came to resemble sportsbook flow, tilted heavily toward longshots and paying substantially for the tilt. The change arrived through new markets and new participants rather than through deterioration within existing markets. This pattern is consistent with the most direct explanation, that the platform's new customers brought their trading habits with them.
These findings do not by themselves impair prediction-market prices as forecasts, since professional liquidity provision continues to discipline quotes. However, they do document a measurable worsening in the outcomes of ordinary participants at precisely the moment the industry found its mass-market product. In short, both facts belong in any assessment of the social value of regulated event markets.
Data and code availability
The data collection framework and the underlying Kalshi dataset are Jon Becker's open-source prediction-market-analysis project, on which this work is built. The analysis code and the complete set of sixty statistical results, including specifications that failed, are available in the replication repository. Sample: trades through May 1, 2026 under a stable 100-contract minimum-volume rule, with the coverage gaps described in Section 3.2, and resolutions as of August 4, 2026.
Corrected September 28, 2026. An earlier version of this article described the platform as having no favorite-longshot bias before the launch, and it misstated the data coverage, the number of market records, and several post-May-2026 figures. It also linked to a repository that did not contain the analysis code. All test results are unchanged. The coverage robustness check in Section 5.2 is new.
References
- Buergi, C., Deng, W., and Whelan, K. (2026). Makers and takers: The economics of the Kalshi prediction market. Working paper, University College Dublin.
- Griffith, R. M. (1949). Odds adjustments by American horse-race bettors. American Journal of Psychology, 62(2), 290-294.
- Snowberg, E., and Wolfers, J. (2010). Explaining the favorite-long shot bias: Is it risk-love or misperceptions? Journal of Political Economy, 118(4), 723-746.
- Thaler, R. H., and Ziemba, W. T. (1988). Anomalies: Parimutuel betting markets: Racetracks and lotteries. Journal of Economic Perspectives, 2(2), 161-174.
- Wolfers, J., and Zitzewitz, E. (2004). Prediction markets. Journal of Economic Perspectives, 18(2), 107-126.